.png)



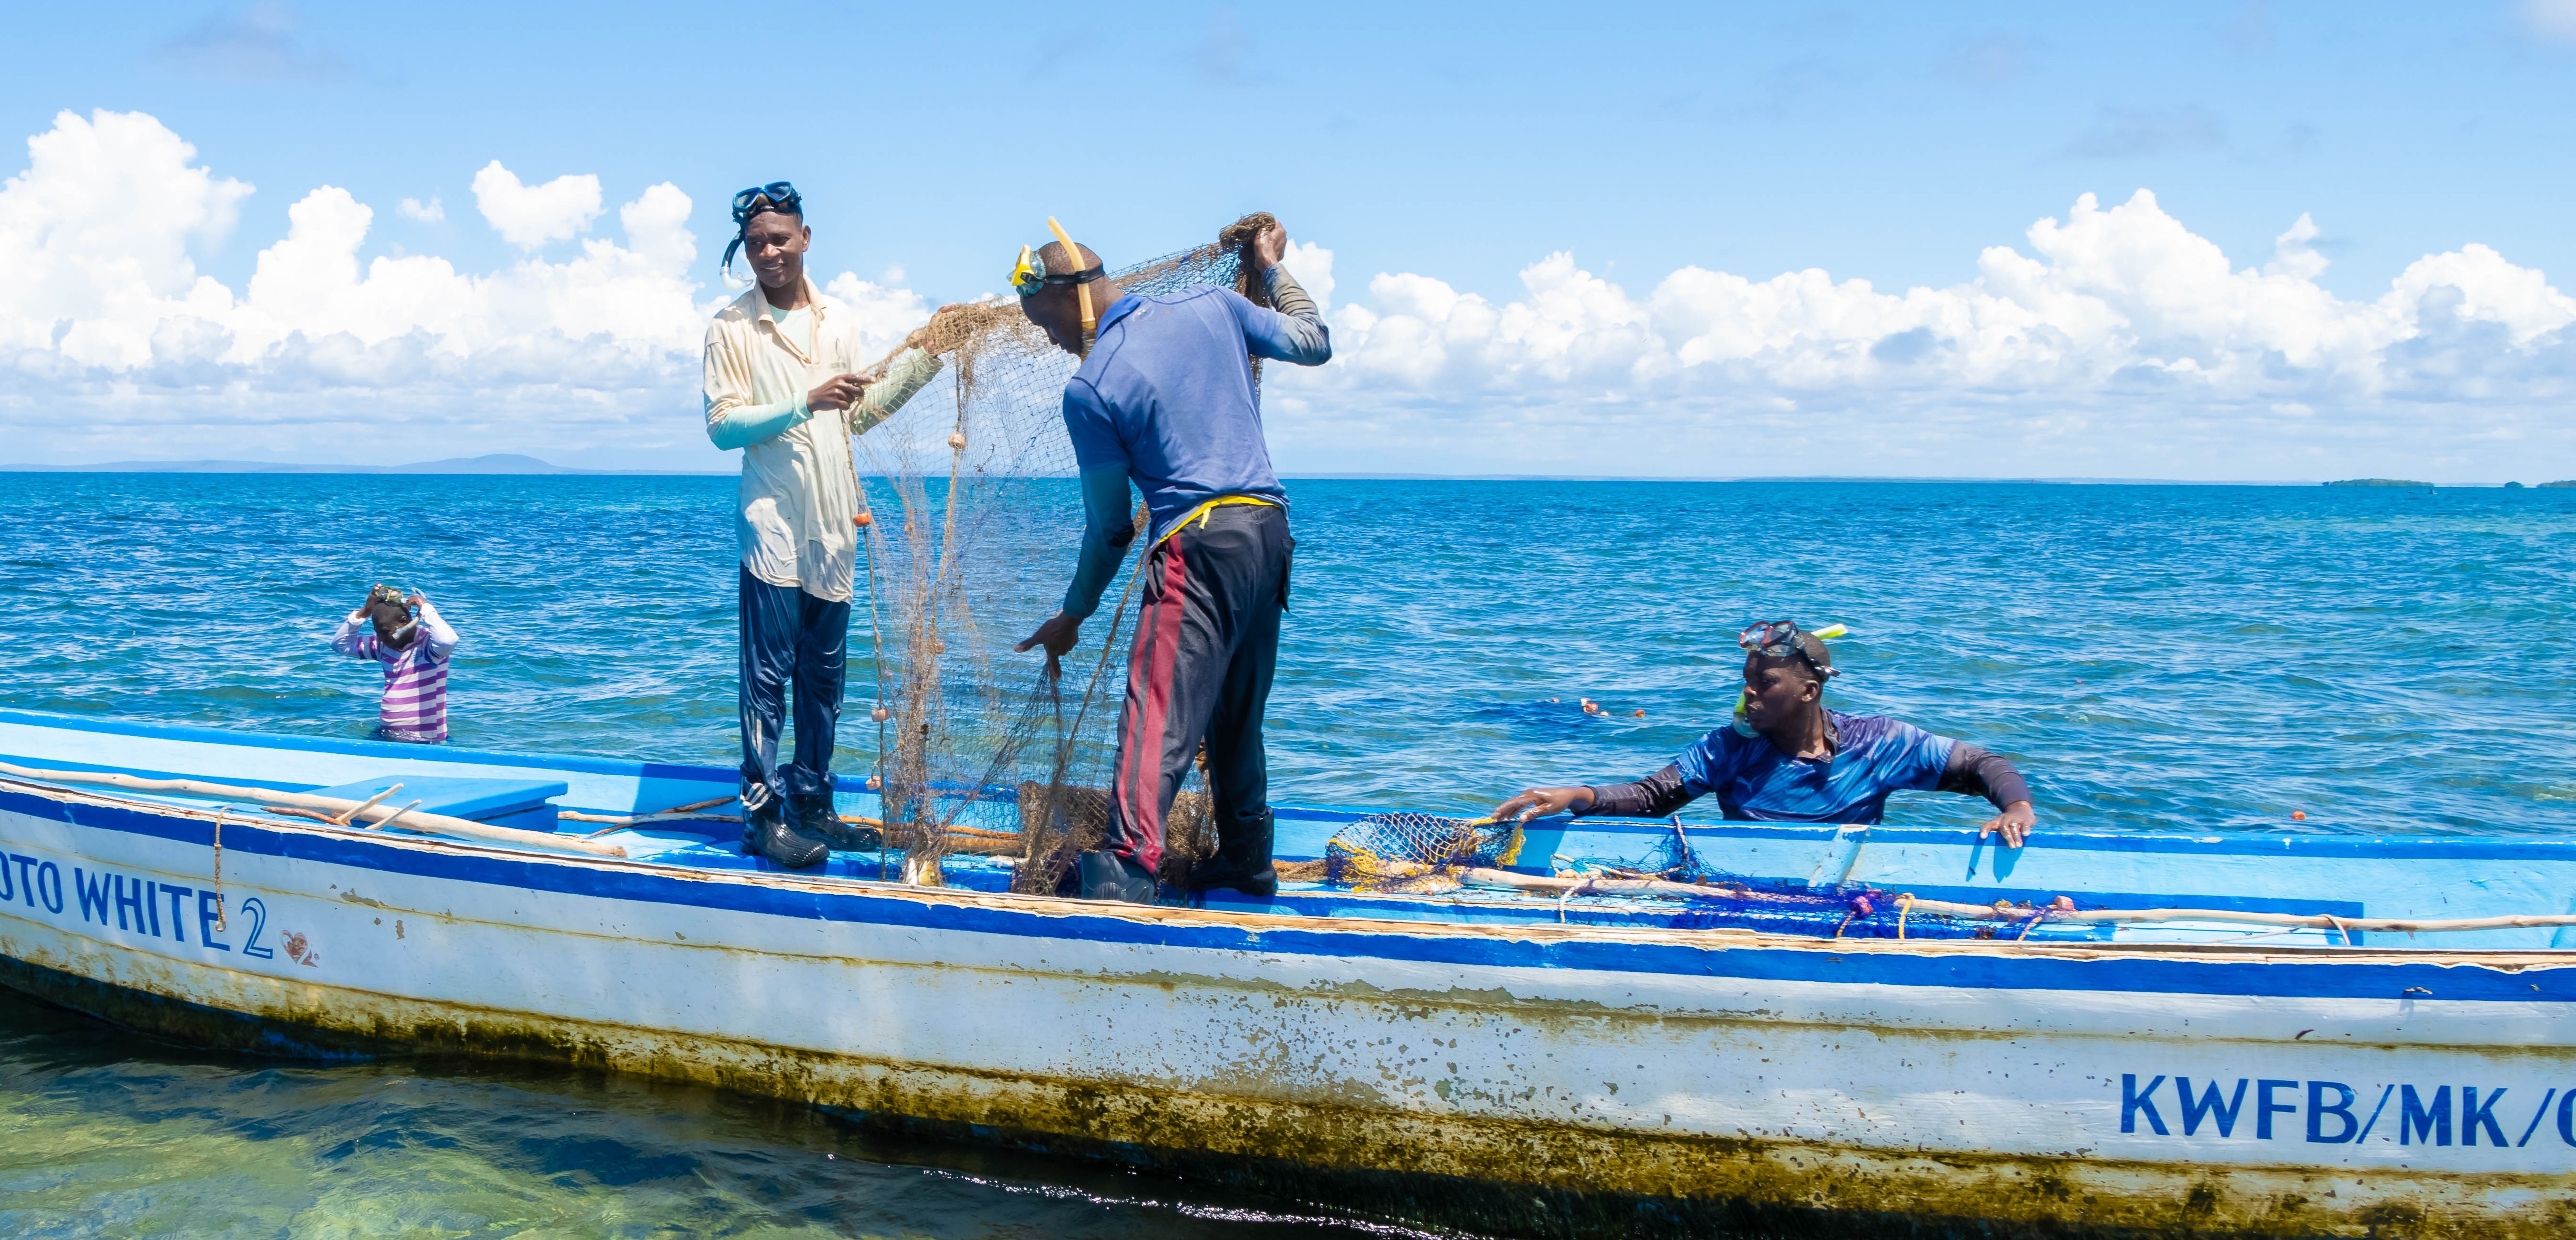
For the families living along the white sands of Kwale and Kilifi, the ocean serves as their livelihood, and their history. For generations, Kenyan fishers have set out into the waves, making daily gambles on which gear to use and where the fish might be hiding. But for a long time, those choices were based on guesswork and whispers of where the fish "used to be".
Today, that is changing. Since 2022, local fishing institutions known as Beach Management Units (BMUs)have partnered with organizations like COMRED and Blue Ventures to turn their daily catches into a powerful tool for change. By recording the details of every trip, these communities are fishing and building a map of their own future.
Understanding the "Work vs. Reward"
Here is a simple idea: how much fish do you get for the work you put in?
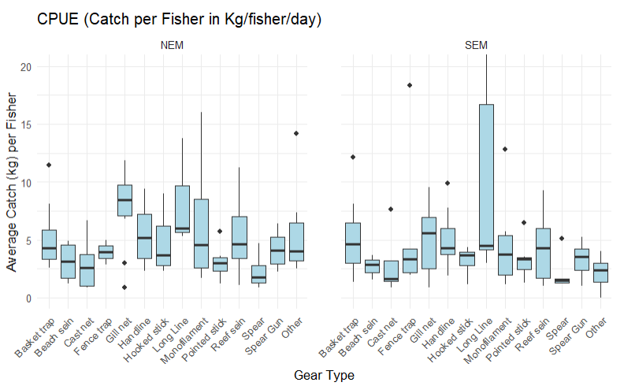
The data has revealed some surprising truths about the tools fishers use every day:
The Big Earners (with a hidden cost): Tools like longlines and monofilament nets bring in the largest catches, especially during the Southeast Monsoon winds. However, the community is learning that these "high-reward" tools can come with an ecological price, sometimes catching young fish or even sea turtles by mistake.
The "Sweet Spot": Handlines have emerged as a community favorite. They are affordable, consistent (bringing in a steady 6–9 kg per fisher), and do very little damage to the reef. For a fisher looking for a stable life and a healthy ocean, the handline is a reliable friend.
The Social Safety Net: Some methods, like the beach seine, don’t catch much fish—sometimes less than 2 kg per person. In the eyes of a cold spreadsheet, they look "inefficient." But in the eyes of the community, they are vital. These nets require a whole group of people to pull together, ensuring that even those without a boat have a way to share in the day’s meal. Beach seines are however very destructive, sweeping indescriminately in the shallow nearshore waters.
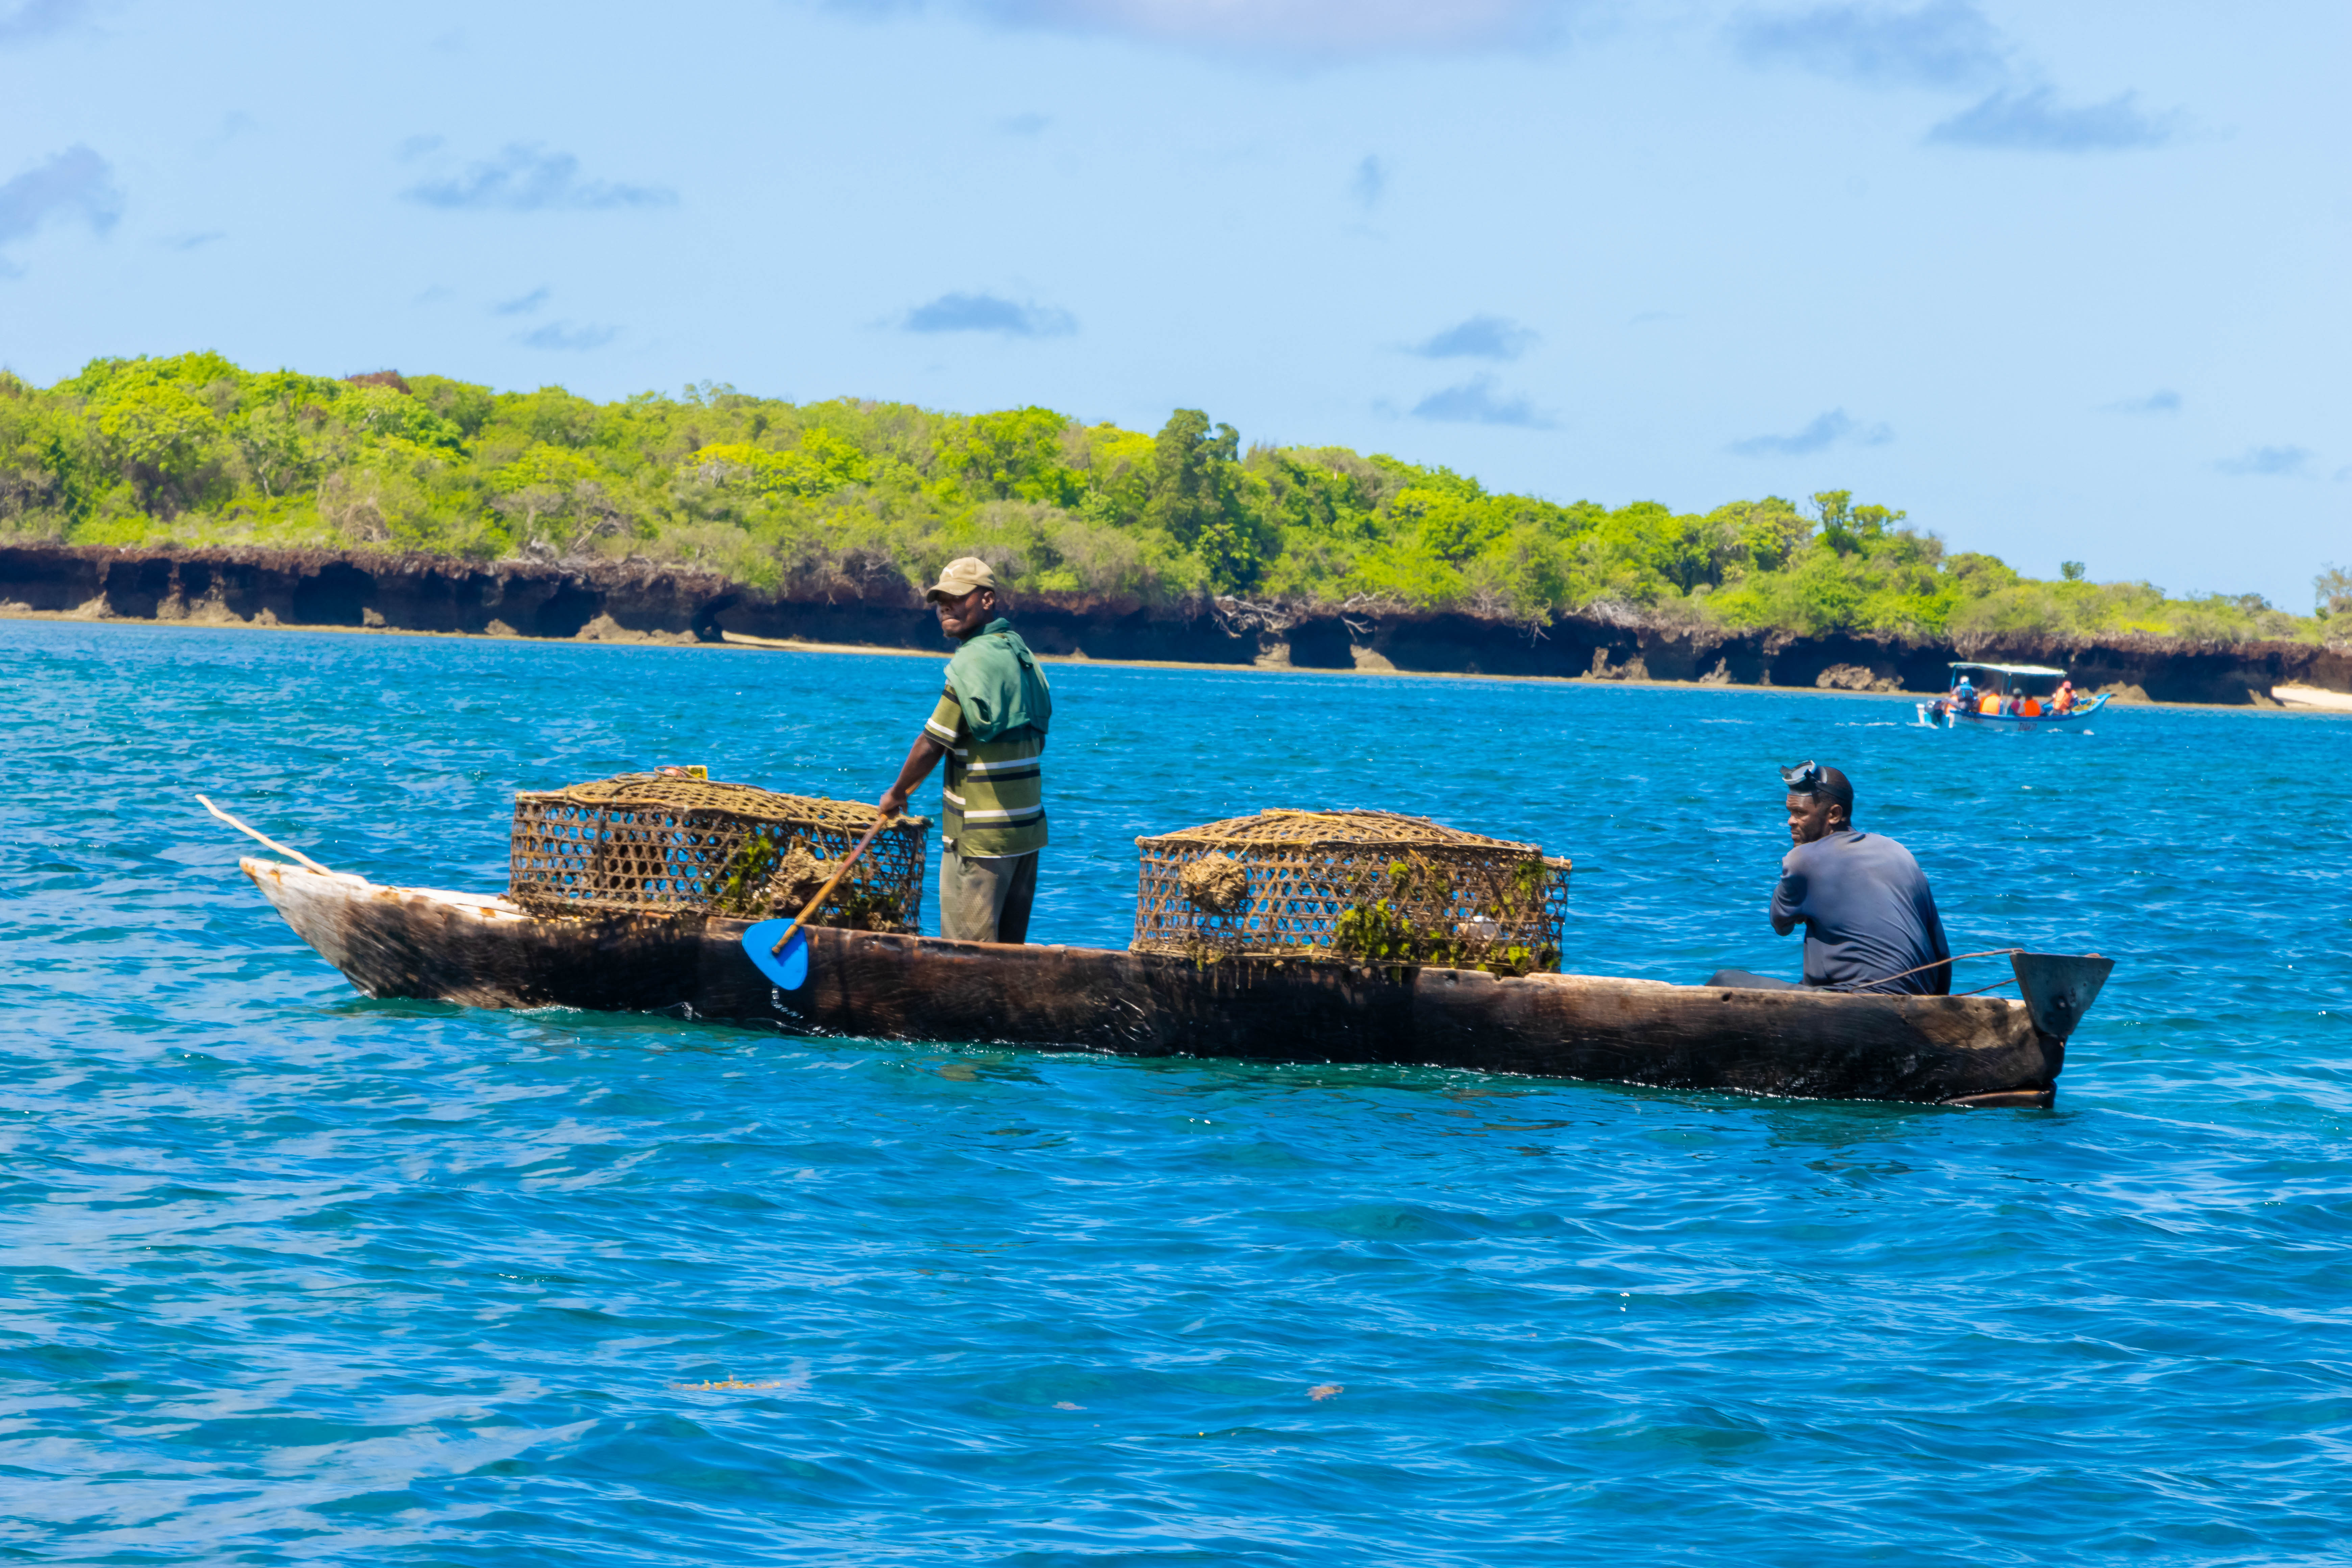
Riding the Rhythms of the Sea
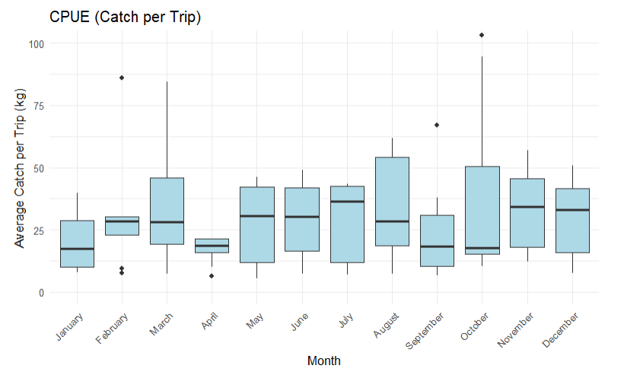
The data has also helped fishers understand the "moods" of the ocean throughout the year. They’ve discovered that July, November, and December are often the most bountiful months, while months like September and January require more patience as catches dip.
Armed with this knowledge, families can better plan for the lean times and invest their hard-earned money more wisely when the seas are generous.
From Numbers to Power
The most significant impact isn’t found in a graph, but in the confidence of the community. In the past, decisions about fishing rules were often made by outsiders based on assumptions. Now, when a BMU sits down to talk about how to protect their waters, they bring their own evidence to the table.
Every catch recorded brings a more transparent and fair way of managing the coast. These fishing communities are proving that when you make the "invisible" work of fishing visible through data, you give people the power to protect their livelihoods and the ocean they call home.